Pulsating Magnetospheric Field-Aligned Electrons
C.E. McIlwain, S.S. Kerr
Center for Astrophysics and Space Sciences, University of California, San Diego, 9500 Gilman Drive, La Jolla, CA, USA 92093
Abstract
The Electron Drift Instruments (EDI) on the Cluster spacecraft are often operated in a mode that measures electron fluxes simultaneously parallel and anti-parallel to the magnetic field, at energies of 500 or 1000 eV. In the burst mode, accumulations are made 128 times per second. Spectrograms made using wavelet techniques covering the frequency range of 0.001 to 64 Hz reveal pulsations in many frequency bands. These pulsations extend from below the Pc-5 band up to and past the Pc-1 frequency band. Often, one direction dominates for a short period, thus indicating the presence of a field-aligned current filament. Individual accumulations are sometimes 50% higher than their neighbors less than 8 ms away. These fast pulses are due likely to the passage of electron solitons travelling along the current filament.
Key words: Cluster, beams, solitons, vortices, aurora
1 Introduction
The Electron Drift Instrument (EDI) can obtain measurements of the electric field E� as well as the gradient of the magnitude of the magnetic field ��B, both in the plane perpendicular to the magnetic field B. EDI operates by emitting a weak beam of electrons from the supporting spacecraft and measuring the drift of the electrons in this beam as they gyrate one or more times in the plane perendicular to B before returning to detectors on the spacecraft. The details of EDI design and operation have been reported by Paschmann et al. (1997), Paschmann et al. (1998) and Vaith et al. (1998).
In order to measure the electron drift continuously and independently of the spacecraft spin phase, EDI must employ two oppositely-oriented detectors, each of which can be directed electronically to view over a full 2� sr. These detectors have tunable energy bandpass and acceptance angle, and achieve
Preprint submitted to Elsevier Science 14 September 2005
high sensitivity via ‘double-angle’ focusing of particles that enter the detector aperture. With its electron guns turned off, EDI then becomes a highly capable detector of ambient particle distributions in selected regions of phase space. Since real-time in situ measurements of the local magnetic-field vector are available to EDI, these regions of phase space may be examined with respect to the magnetic field at high time-resolution, independently of the spacecraft spin phase.
EDI was launched on all four of the Cluster spacecraft in 2000 and is operating currently on three of the spacecraft. The measurement of electron drift is carried out by emitting and detecting electrons with energies of 500 eV or 1 keV. When operated in an ‘ambient’ mode, the EDI detector can measure ambient particle fluxes at these same energies and at pitch angles of 0�, 90� and 180�. Although the EDI detectors are able to measure ion fluxes, only electron fluxes have been measured to date. Depending on the telemetry mode, count samples are supplied from both detectors once every 64 ms or 8 ms.
Data obtained using this ‘ambient’ mode while in the magnetotail reveals frequently the presence of electron beams (Runov et al., 2004; Asano et al., 2005). The on-board EDI ambient mode software was improved in the fall of 2004. The EDI data discussed in this paper take advantage of these improvements.
2 Quiet Magnetotail
Figure 1 shows an example of 0� and 180� pitch-angle electron count data gathered on 2004/10/27 06:00–18:00 UT by the EDI detectors on Cluster spacecraft 1 (C1) with the ambient mode described above. Also shown are the magnitude of the magnetic field B and its cone angle with the spacecraft spin axis. Figure 2 ‘zooms’ from 12 h to 20 min and 1 min intervals for the 180� data shown in figure 1. Few fast variations are present during this quiet time period.
These data are shown as count rates per accumulation interval and have been corrected for variations in the response of the EDI detector as a function of the polar and azimuthal look-directions in the detector’s reference frame.
3 Wavelet Analysis and the Use of Color
Spectral analysis was carried out on these data using wavelet techniques. Mor-let wavelets were used exclusively with the ‘nondimensional frequency’ parameter typically chosen to be between 3 and 6.
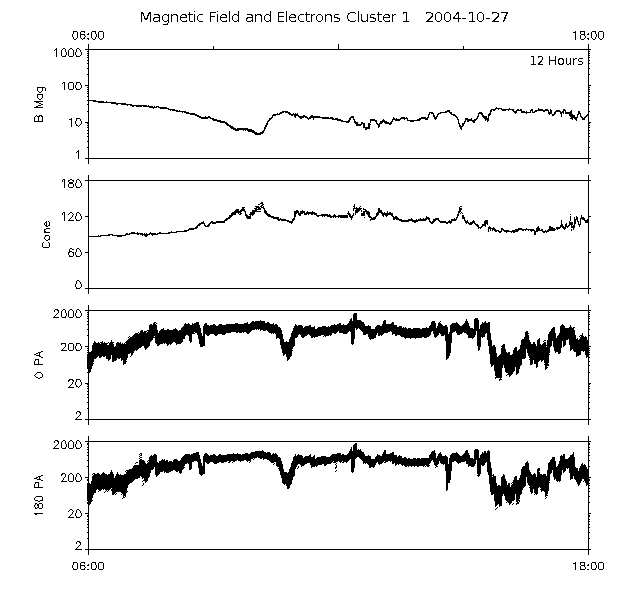
Fig. 1. Plots of the FGM magnetic-field magnitude and cone angle, and the parallel and anti-parallel 0.5 keV electron count data from EDI on Cluster spacecraft 1 (C1) for the 6 to 18 UT time period on Oct. 27, 2004. During this period, C1 was near L = 17 and magnetic local time 21 h. The Kp values varied from 0 to 2−.
Because Morlet wavelets are complex-valued, they can provide phase as well as amplitude information about the time-frequency spectrum. The EDI detectors are able to sample electron fluxes simultaneously in two opposite directions, and can perform rapid surveys at several pitch angles. In addition, EDI data can be compared with EDI data from other spacecraft, or with data from other instruments on the same spacecraft.
The task of analyzing a high-resolution dataset with such a large number of dimensions has motivated the authors to develop and employ a visualization technique based on color overlays. In addition to assigning two parameters (e.g., time and frequency) to the horizontal and vertical dimensions of a typical display medium, we have assigned the three color components (red, green and blue) to three parameters related to the spectral data.
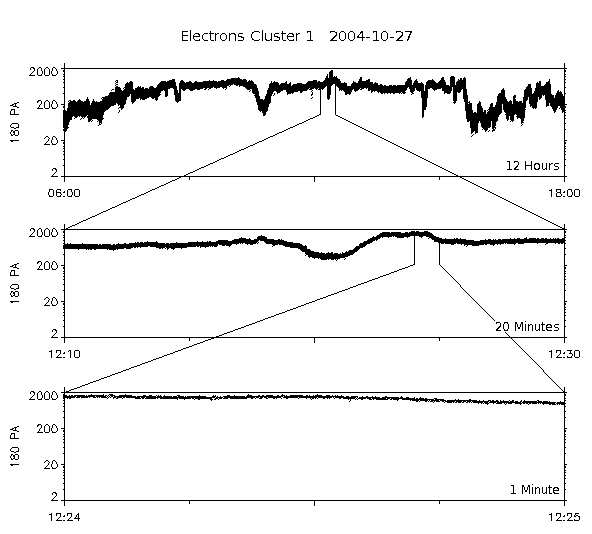
Fig. 2. The anti-parallel count data from figure 1 over time periods of 12 h, 20 min and 1 min. Note the relative absence of fluctuation on time scales of less than one minute.
For example, figure 3 displays EDI ambient electron data with the amplitude of the 0� spectral data assigned to the blue channel, the 180� to the green channel and the relative phase of these two spectra (scaled to amplitude) to the red channel. With the data thus assigned, an equal electron flux in both pitch angles with 180� relative phase will appear as a shade of gray. Therefore, an abundance or absence of any of the three colors would indicate an anisotropy or a variation in relative phase, or both. Specifically, cyan reveals the presence of green and blue together (or equivalently the absence of red) indicating equal fluxes in phase. Similarly, magenta (or yellow) reveals an anisotropy with an abundance of 0� (180�) flux that is out of phase with its 180� (0�) counterpart. All other colors indicate various contributions from the three data channels.
While this method of presenting phase or flow features in the spectra lacks the quantitative precision of other methods such as hodograms or ‘clock-hand’ vector fields, it offers the advantage of higher resolution and contrast for these features in frequency-vs-time spectral images. The visibility of spectral fea
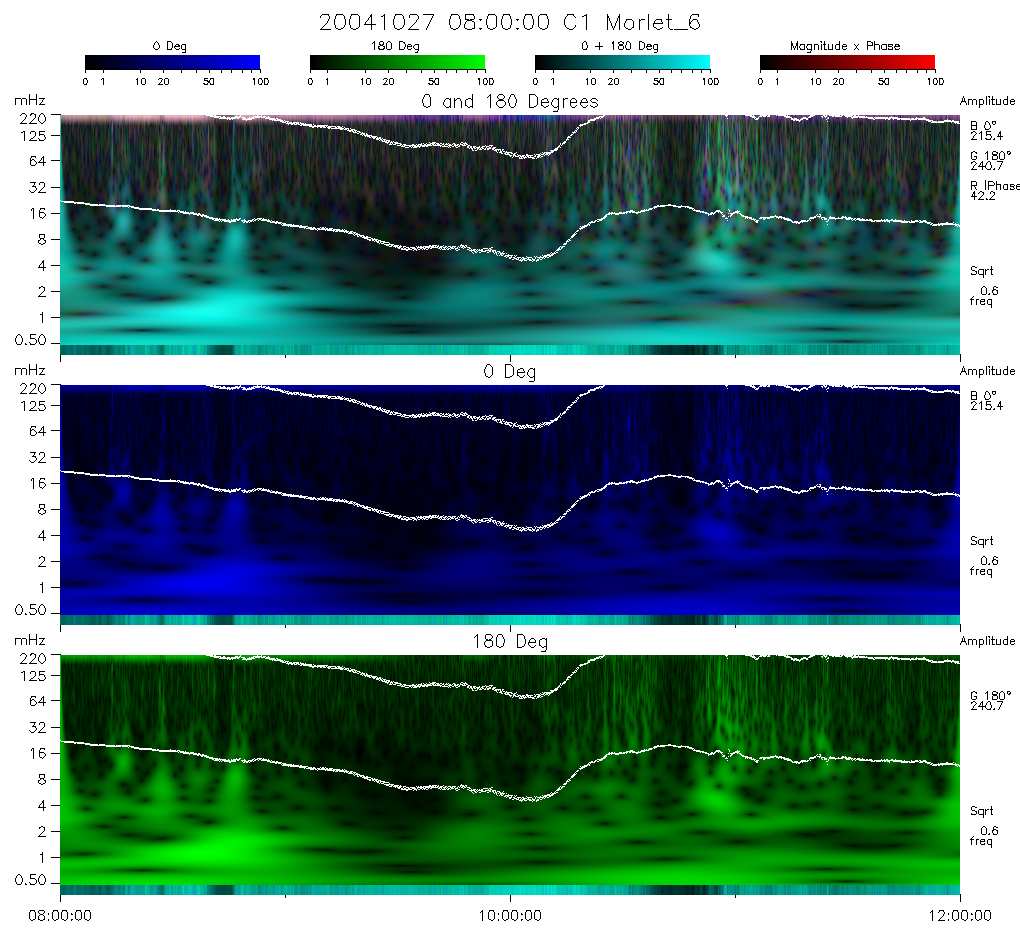
Fig. 3. The spectrum of the parallel 0.5 keV electrons is shown in green in the bottom panel for the 8 to 12 UT time period, the anti-parallel spectrum in blue in the middle panel, and the combined spectra in the top panel along with their magnitudes times the relative phase in red. The lower white-line plot is the magnitude of the magnetic field in nT and the upper white line is the proton gyrofrequency in mHz.
tures is enhanced by flattening the spectra by a power-law frequency dependence.
Figure 3 shows 0.5–240 mHz spectral data from 08:00 to 12:00 UT for the same day and spacecraft as for figures 1 and 2. The use of color in the 0�, 180� and 0�+180� panels is illustrated. The similarity of the spectra for the two directions is revealed by the absence of blue and green in the top panel. Note also the 1 and 2 mHz lines in both the 0� and 180� pitch-angle spectra from 11 to 12 UT.
In figure 4, the 0�+180� combined spectral data (0.5-240 mHz) from Cluster spacecraft 1, 2 and 3 are displayed together to facilitate comparison. Again, note the relative absence of blues and greens, as well as the similarities between spacecraft.
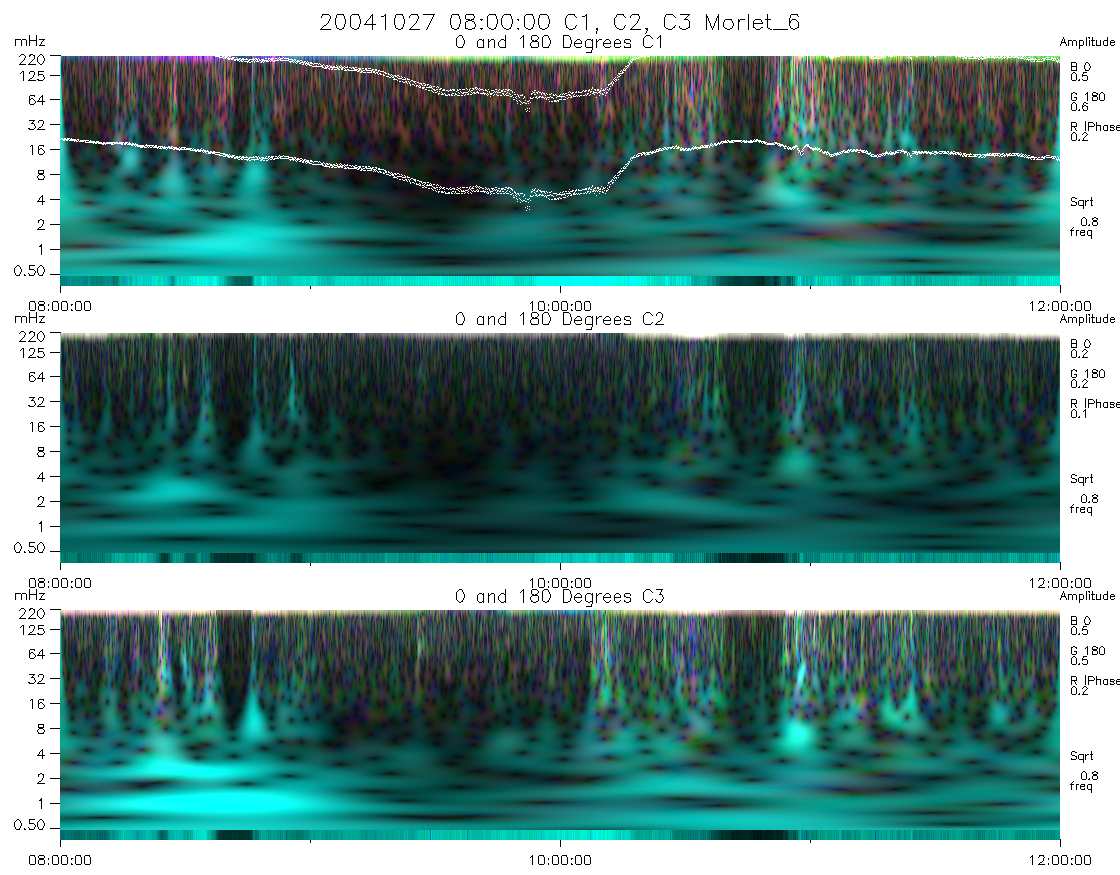
Fig. 4. The EDI ambient electron spectra from Cluster 1, 2, and 3 for the same time interval as figure 3. Note that the spectra show many similarities even though the spacecraft are separated by about 1000 km.
Figure 5 shows 0.5–125 mHz spectral data from EDI and the on-board fluxgate magnetometer (FGM) overlaid with colors to display relative power and phase. The spectra of the magnitude of the magnetic field is shown in blue, and the B� spectra (created from the cross products with the vector field at the mid-time of the plot) is shown in green. Note that there are similarities between the electron and magnetic-field spectra in addition to the strong differences. The magnetic-field values shown here are from the spin-averaged prime parameters. Future studies are planned that will use B-field values of higher time resolution.
4 Disturbed Magnetotail
Figure 6, shows the B field and the EDI ambient electron count data as Cluster 1 went from L = 14.4 to L = 17.8 at a local time of about 20 during a very disturbed period. For over 3 hours in the initial part of this period, the magnetic field remained relatively stable, while the electron count rates exhibited strong and rapid fluctuations.
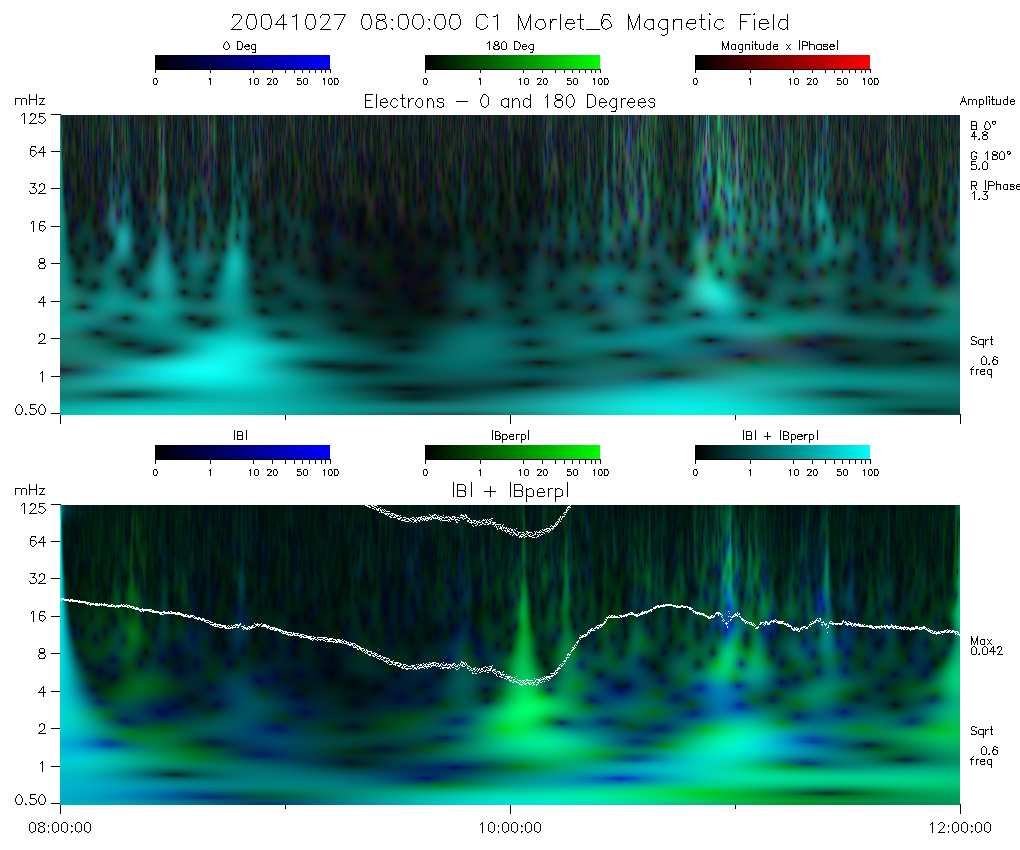
Fig. 5. EDI ambient electron and FGM spectra from 8 to 12 UT on Oct. 27, 2004. The spectra of the spin-averaged magnetometer data shown in the bottom panel has few features that match the electron pulsations. The modulation of these electrons traveling along the magnetic field likely occurs at some distance from the spacecraft.
Figure 7 displays successively shorter time intervals of the 180� pitch-angle data, from the same 12-hour time period as shown in figure 6. The bottom two panels show the 180� and 0� data over a 10 s interval, in which the 180� data exhibited multiple sharp peaks while the 0� data was relatively constant. These data were gathered with EDI operating in the normal telemetry mode, with 16 samples taken every second, each over an accumulation time of 15.6 ms. Strong time-variations are evident in these peaks; these variations may be from variations beyond the 8 Hz Nyquist frequency. The 15.6 ms accumulation time gives a substantial response up to 50 Hz and higher.
Figure 8 displays the (0,180,phase) overlaid wavelet spectra for the 60-minute interval shown in the second panel of figure 7, along with the (B,B,B+
) overlaid spectra. Similarities in the spectra are evident, along with no-
|B�|
table differences such as the rise in perpendicular fluctuation of B from 11:00 to 11:05 in the range from 3 to 32 mHz, with no companion feature in the electron spectrum.
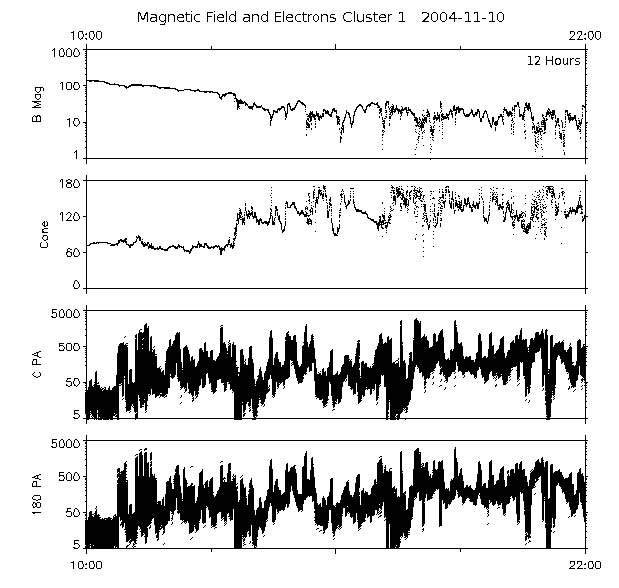
Fig. 6. FGM B-field and EDI electron-count rates in the magnetotail with Kp values ranging from 7+ to 4+ during a 12-hour period on Nov. 10, 2004. Note that the magnetic field remained relatively stable during the initial part of this period, while the electrons exhibited strong, rapid variations.
5 Magnetopause and Cusp near Perigee
Earlier on Nov. 10, 2004, Cluster spacecraft 2 (C2) was operating in the burst mode as it approached the magnetopause/cusp near perigee at less than 5 RE at a magnetic local time of 9 h, while Kp =8+ . It is likely that Cluster 2 encountered vortices of the type discovered by Sundkvist et. al. (2005) during this time period. These vortices may have been accompanied by electron-acoustic solitary waves involving beams of electrons, such as those discussed by Shukla et al. (2004).
Figure 9 presents line plots over 50 min, 4 min, 40 s, 8 s and 2 s of 0� pitch-angle data at energy W = 500 eV. A sharp spike that occurred at 04:42:59.5 over a 7.8 ms accumulation time is marked with an arrow. It is likely that this
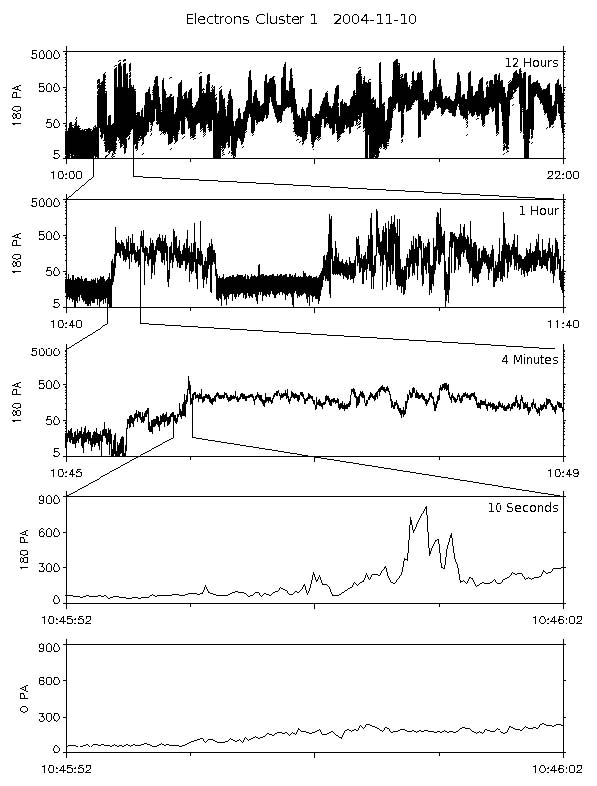
Fig. 7. EDI 180� pitch-angle electron count data from C1 over the same 12 h period shown in figure 6, with zooms to 1 h, 4 min, and 10 s. The bottom panels shows the 0� data for the same 10 s interval. Note the differences and the multiple peaks in the 180� pitch-angle data that are likely due to undersampled fast time variations.
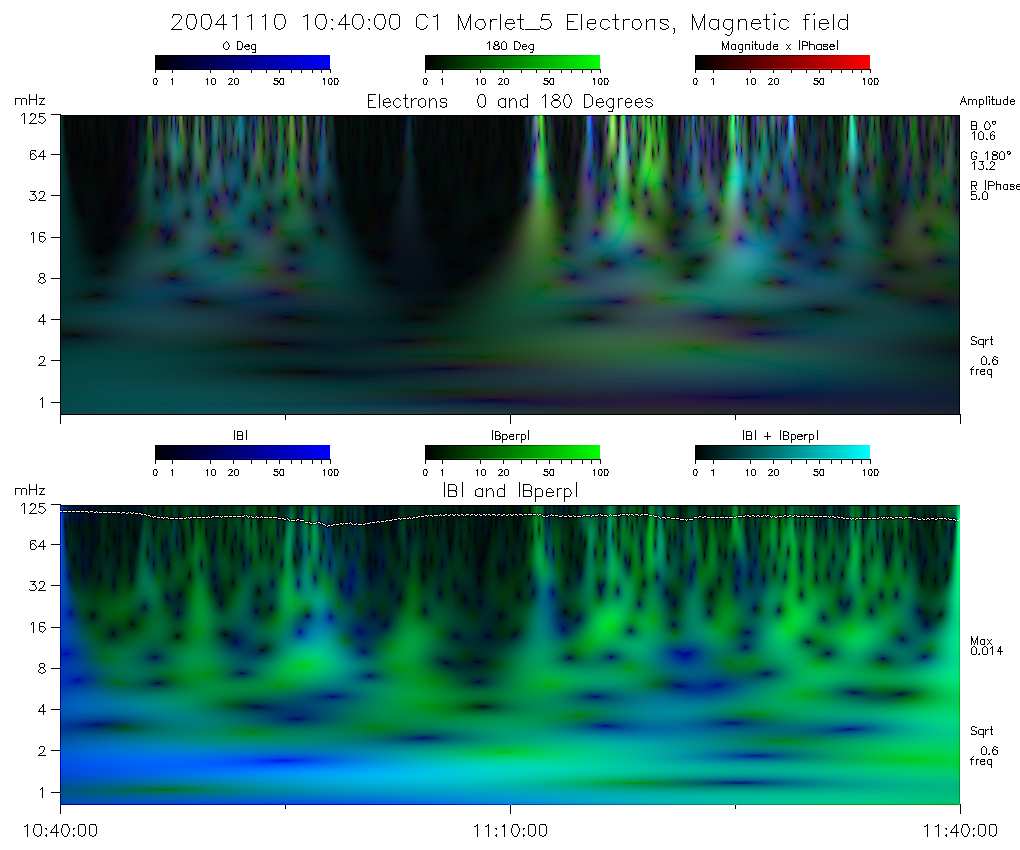
Fig. 8. Spectra of the 0� and 180� pitch-angle EDI electron count data for the same 60 m interval as the one shown in the second panel of figure 7. The lower panel shows the spectrum for the magnetic field during the same interval.
spike is due to a field-aligned packet of electrons driving a soliton past the spacecraft. The accumulation time of 7.8 ms times the velocity of a 500 eV electron corresponds to a packet length of 100 km or less. For a beam narrower than the detectors’ acceptance angle of 15� × 30�, the effective area times the efficiency is about 0.4 cm2. The observed peak of 3135 counts in 7.8 ms would thus correspond to 106 electrons cm−2s−1 or 1.6 nA m−2 within the detectors’ energy pass-band of about 460 to 540 eV.
Figure 10 shows the overlaid EDI ambient electron spectra for the 50 min time period shown in figure 9, along with the overlaid B-field spectra while the magnitude varied between 554 and 614 nT. In the top panel is a 48 s detail of the overlaid electron spectra that includes the time of the spike in the 0� pitch-angle flux, marked with a down-caret in both panels. This spike (and others) in the 0� data appear as a region of blue in the overlaid spectra in the frequency ranges around 1 and 30 Hz.
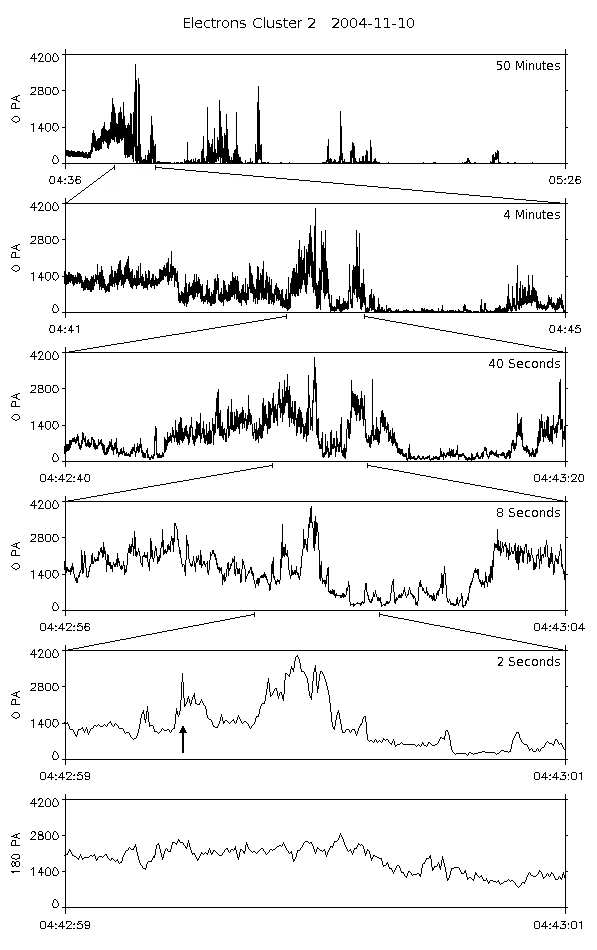
Fig. 9. EDI 0� pitch-angle electron count data from C2 on Nov. 10, 2004, showing successively smaller time intervals from 50 min to 2 s. The bottom panel shows the 180� data for the same 2 s time period. The arrow marks the sharp (8 ms) spike at
04:42:59.5 UT. C2 was near perigee (R = 4.4, L = 8, LT= 8.8).
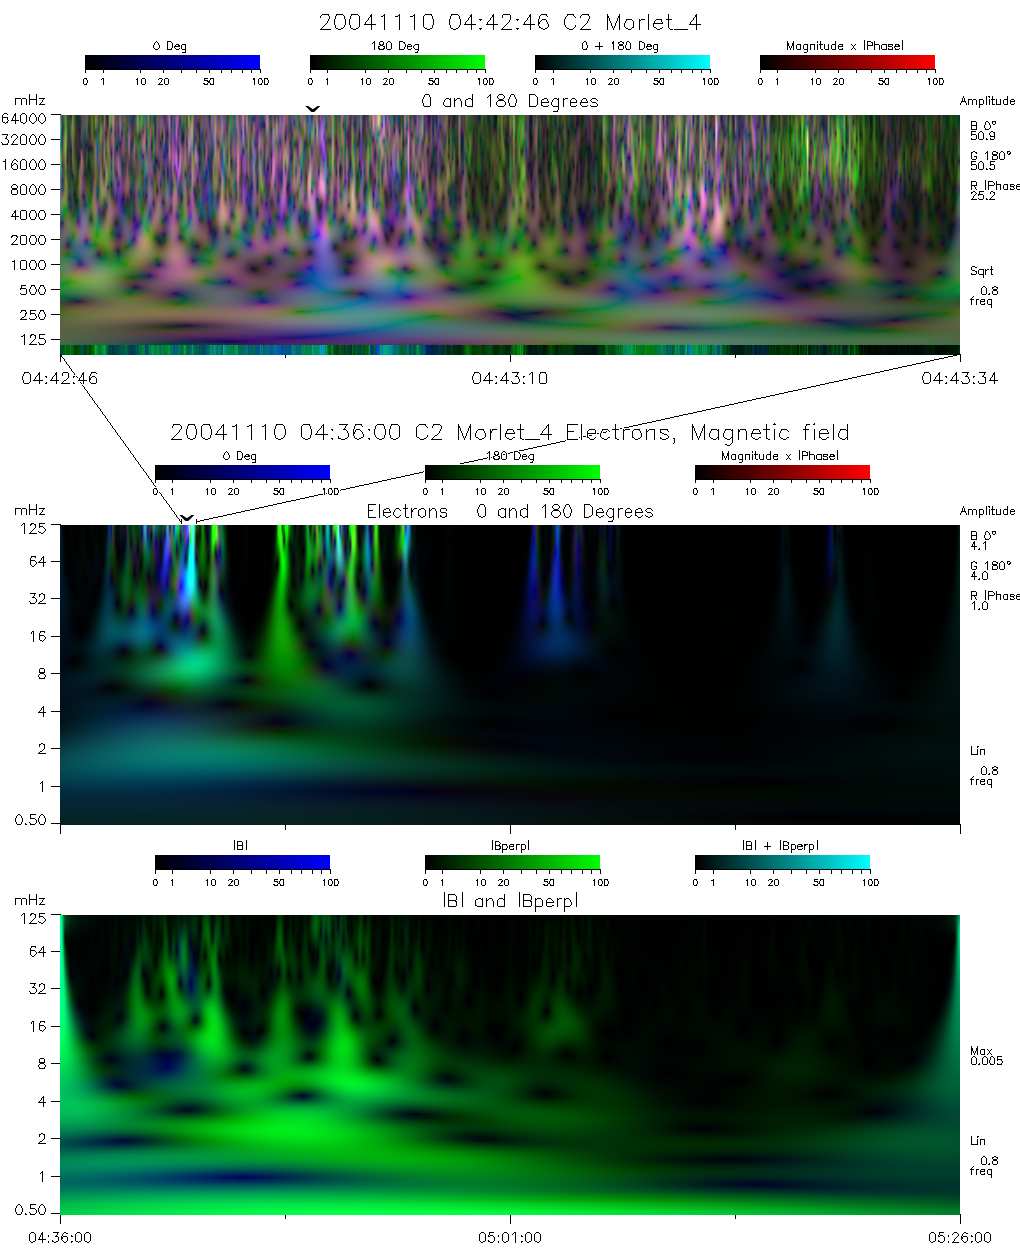
Fig. 10. The lower two panels show EDI ambient electron and FGM B-field spectra from 0.5 mHz to 125 mHz for the same 50 min time period shown in figure 9. The upper panel shows the combined 0+180+phase spectra from 125 mHz to 64 Hz for a 48 s interval that overlaps nominally with the 40 s interval shown in figure 9. The spikes in the 0� at 04:43 appear in the spectra as a region of blue in the range 0.5–2 Hz.
6 Magnetopause and Cusp at 11 RE
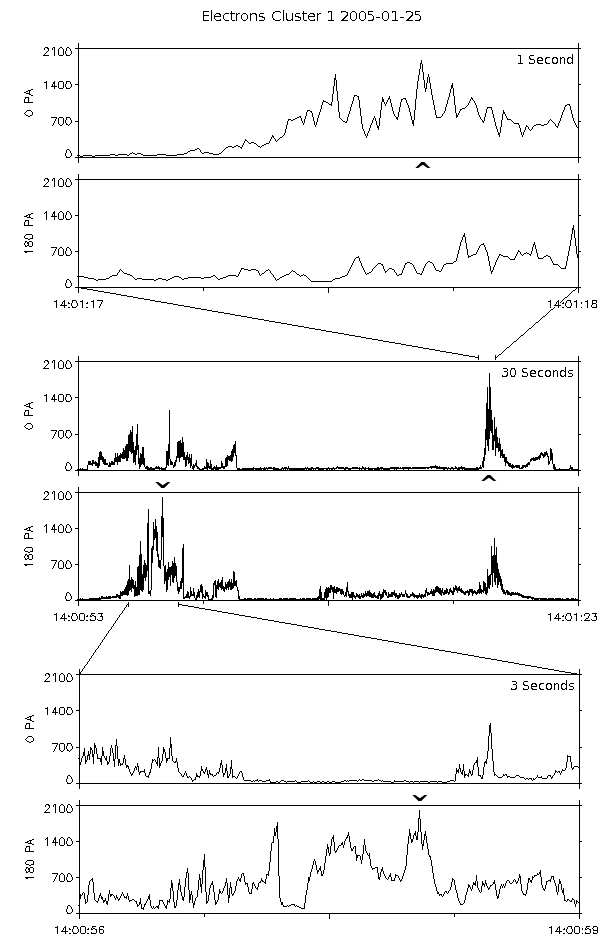
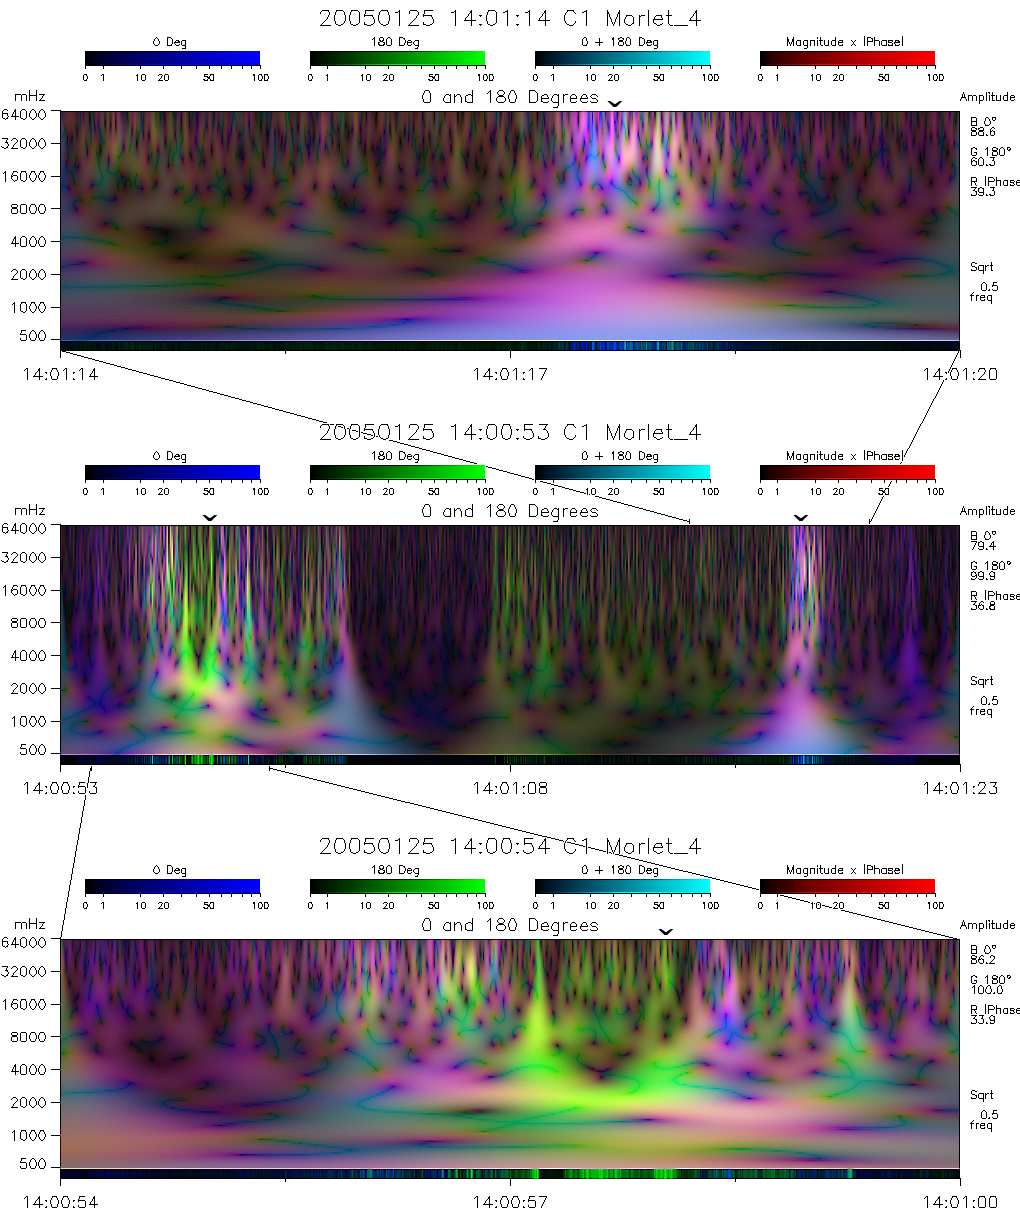
On Jan. 25, 2005, Cluster 1 was operating in the burst mode as it approached the magnetopause/cusp during a quiet Kp = 1 period at R = 11.3, L = 15.5 and MLT=15.5. Figure 11 shows two bursts of field-aligned 500 eV electrons within a 30 s period. The first burst is predominantly anti-parallel, and the second is predominantly parallel. Both contain sharp peaks that are probably unresolved even with the 7.8 ms data-point spacing that EDI can achieve. Figure 12 shows the spectra of these two bursts. No discrete spectral peaks are revealed; only broad bands are visible near 3, 10 and 30 Hz.
These fast variations, as in other cases shown here, are probably associated with auroral acceleration processes (Bounds et al., 1999; McFadden et al., 2003; Ergun et al., 2004). Electron beams are observed regularly in the regions immediately above auroral displays, and it is usually assumed that beams observed beyond 4 RE are also connected to auroras (McIlwain, 1975).
7 Conclusions
The observations presented here of large fluctuations and the relative absence of periodic variations indicates the presence of turbulence generated by non-linear processes. Future studies using high-time-resolution electric-and magnetic-field data are expected to confirm the soliton origin of the observed packets of field-aligned electrons and their relationship to auroral acceleration processes.
Acknowledgements
We are indebted to E. Howatt for developing much of the software used to process and display the wavelet spectra of the EDI data. We are also grateful to B. Yukich and X. Lee for their valuable assistance in the preparation of this paper, and to the other members of the EDI team for many insightful discussions. We acknowledge with thanks A. Balogh and E. Lucek for permission to use FGM data from CDAWeb in this paper, and M.A. Hapgood for providing data on the Cluster orbit and L values. This work was supported by NASA grant NNG04GA46G.
References
Asano, Y., Nakamura, R., Runov, A., Baumjohann, W., McIlwain, C., Paschmann, G., Quinn, J., Alexeev, I., Dewhurst, J.P., Owen, C.J., Fazakerley, A.N., Baloghf, A., R`eme, H. and Klecker, B., 2005. Detailed Analysis of Low-Energy Electron Streaming in the Near-Earth Neutral Line Region During a Substorm. Adv. Space Res. 35. in press.
Bounds, S.R., Pfaff, R.F., Knowlton, S.F., Mozer, F.S., Temerin, M.A., and Kletzing, C.A., 1999. Solitary potential structures associated with ion and electron beams near 1 RE altitude. J. Geophys. Res. 104, 28709.
Ergun, R.E., Andersson, L., Main, D., Su, Y.-J., Newman, D.L., Goldman, M.V., Carlson, C.W., Hull, A.J., McFadden, J.P., Mozer, F.S., 2004. Auroral Particle Acceleration by Strong Double Layers: The Upward Current Region. J. Geophys. Res. 109(A12), A12220.
McFadden, J.P., Carlson, C.W., Ergun, R.E., Mozer, F.S., Muschietti, L., Roth, I., and Moebius, E., 2003. FAST observations of ion solitary waves.
J. Geophys. Res. 108(A4), 8018.
McIlwain, C.E., 1975. Auroral Electron Beams Near the Magnetic Equator. In Physics of the Hot Plasma in the Magnetosphere, ed. Bengt Hultqvist and Lennart Stenflo, Plenum Press, 91, 1975.
Paschmann, G., Melzner, F., Frenzel, R., Vaith, H., Parigger, P., Pagel, U., Bauer, O.H., Haerendel, G., Baumjohann, W., Sckopke, N., Torbert, R.B., Briggs, B., Chan, J., Lynch, K., Morey, K., Quinn, J.M., Simpson, D., Young, C., McIlwain, C.E., Fillius, W., Kerr, S.S., Maheu, R., and Whipple, E.C., 1997. The Electron Drift Instrument for Cluster. Space Sci. Rev. 79, 233.
Runov, A., Asano, Y., V¨os, Z., Nakamura, R., Baumjohann, W., Paschmann,
Paschmann, G., McIlwain, C.E., Quinn, J.M., Torbert, R.B., and Whipple, E.C., 1998. The Electron Drift Technique for Measuring Electric and Magnetic Fields. In R.F. Pfaff, J.E. Borovsky and D.T. Young (eds.), Measurement Techniques in Space Plasmas – Fields. AGU Geophysical Monograph 103, 29. or¨G., Quinn, J., McIlwain, C., Balogh, A., and R`eme, H., 2004. Cluster Magnetotail Probe During the 13 September 2002 Substorm. in Proc. ICS-7. 188, 2004. in press.
Shukla, P.K., Mamun, A.A., and Eliasson, B., 2004. 3D Electron-Acoustic Solitary Waves Introduced by Phase Space Electron Vortices in Magnetized Space Plasmas. Geophys. Res. Lett. 31, L07803.
Sundkvist, D., Krasnoselskikh, V., Shukla, P., Vaivads, A., Andr´e, M., Buchert, S., and R`eme, H., 2005. In Situ Multi-Satellite Detection of Coherent Vortices as a Manifestation of Alfv´enic Turbulence. Nature 436, 825, August 11, 2005.
Torrence, C., and Compo, G., 1998. A Practical Guide to Wavelet Analysis. Bull. Amer. Meteor. Soc. 79, 61.
Vaith, H., Frenzel, R., Paschmann, G., and Melzner, F., 1998. Electron Gyro Time Measurement Techniques for Determining Electric and Magnetic Fields. In R.F. Pfaff, J.E. Borovsky and D.T. Young (eds.), Measurement Techniques in Space Plasmas – Fields. AGU Geophysical Monograph 103,
47.